
Sugar Correlation in Student Obesity
This code analyzes meal evaluation data and BMI using R, calculating correlations, visualizing distributions with boxplots and word clouds, identifying high-risk students, and assessing program impact on snack/drink consumption with paired t-tests.
Purpose
Examine meal habits’ impact on BMI and program effectiveness.
Statistical Techniques:
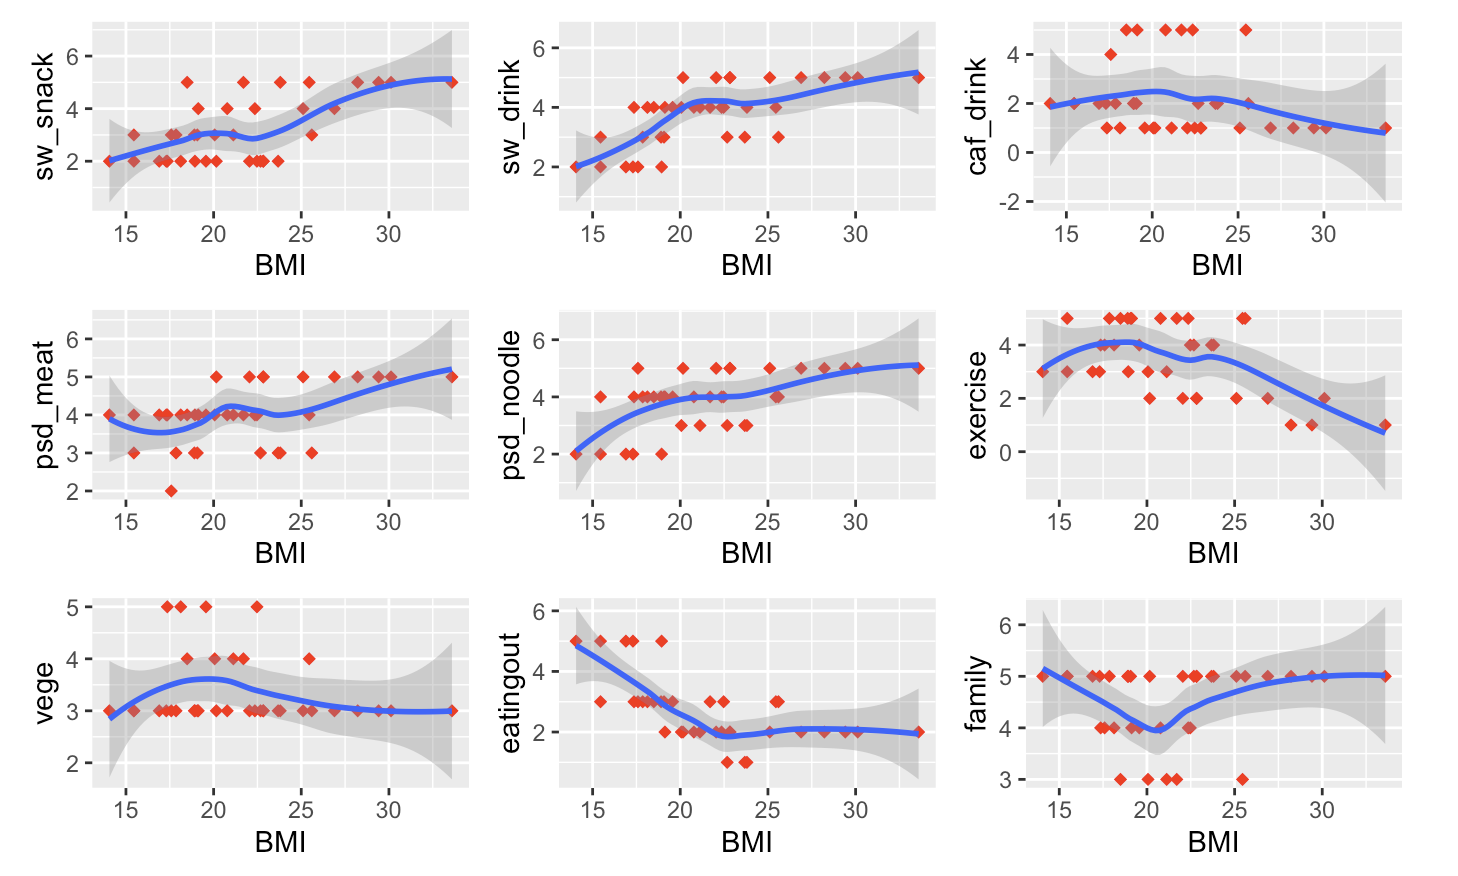
- Correlation analysis (Measures BMI-food relationships with Spearman)
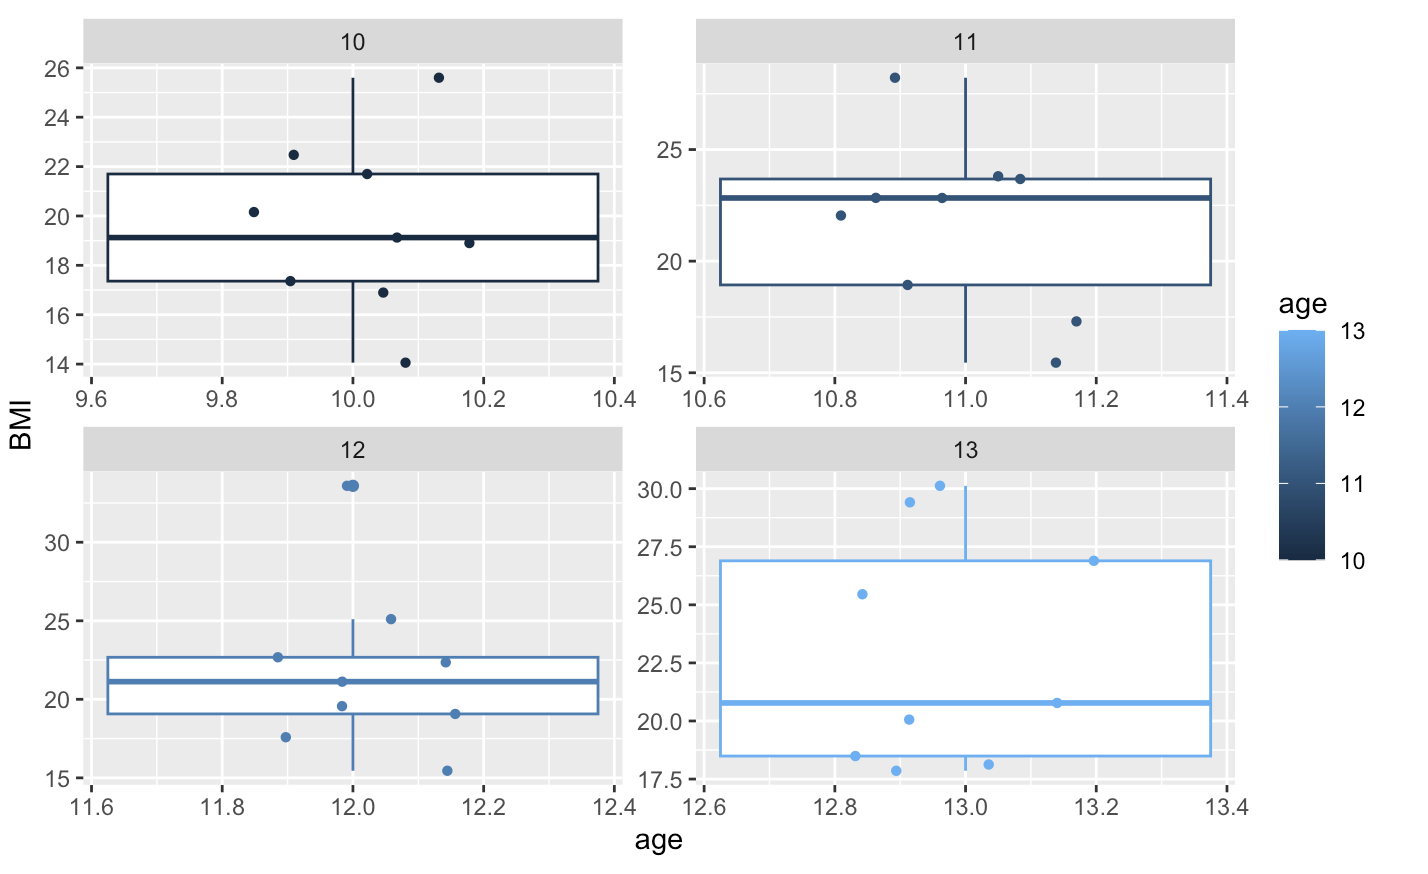
- Boxplots (Visualizes BMI distribution by grade; shows spread and outliers per age)
- Subsetting (Identifies high-risk students; filters BMI >= 23)
- Paired t-tests (Compares pre/post consumption; program’s effect)
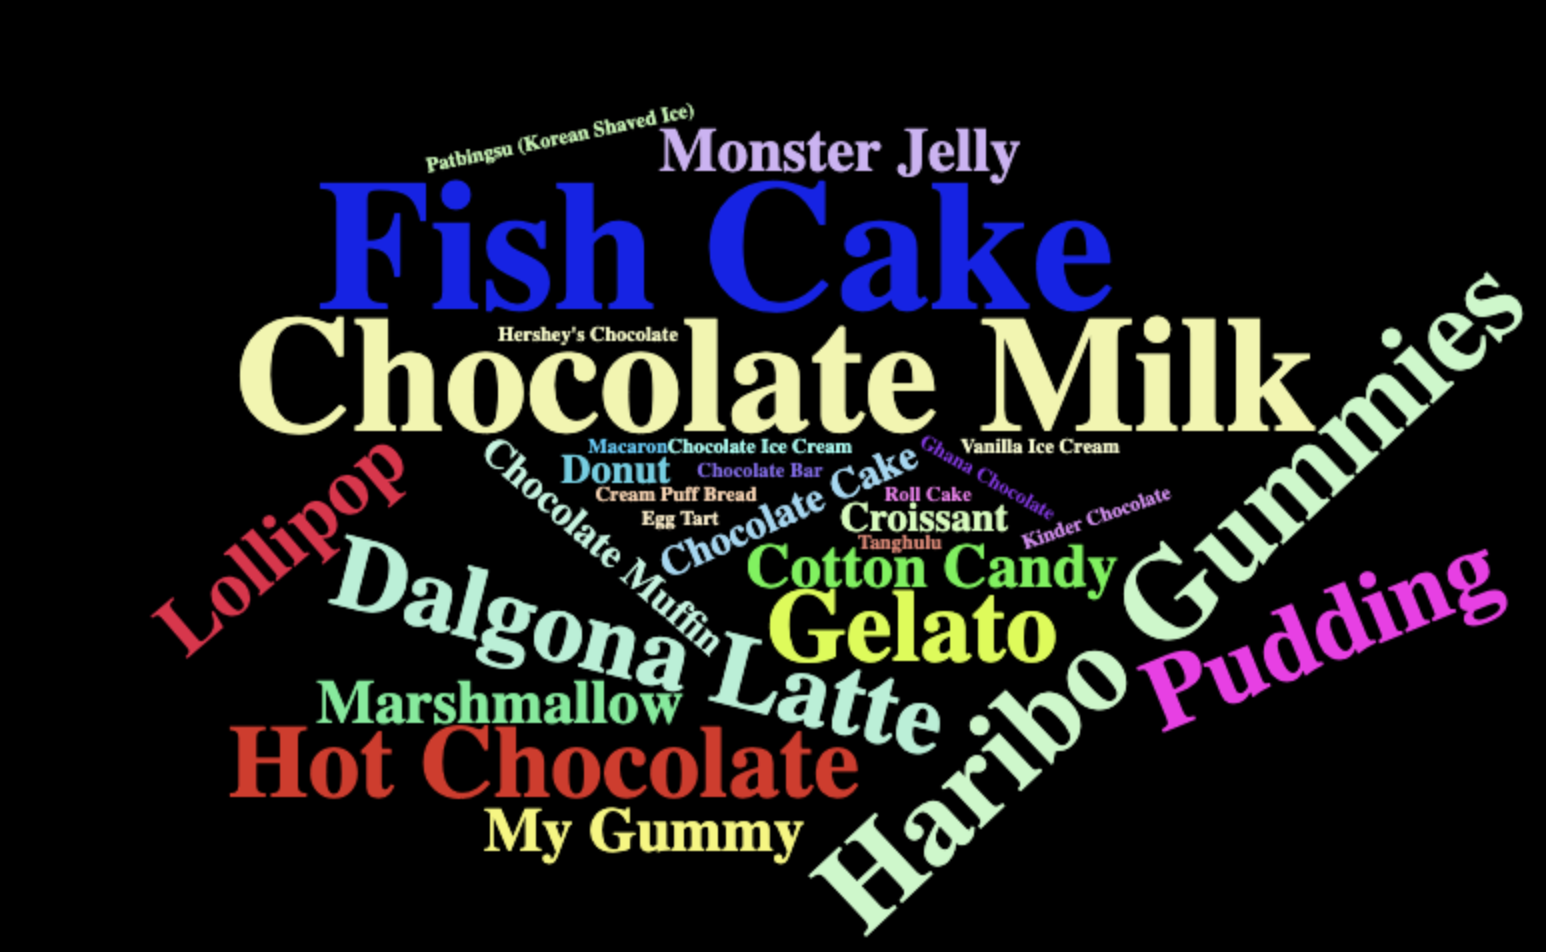
- Wordcloud (Displays snack frequency patterns)
Output
- Correlation coefficients
- BMI boxplots
- word cloud.
- Correlation coefficients